The mod was completed on 6/26/2023, you can play it on the Campaign Trail Showcase, as 2016d: Rubio vs Biden. It’s still unbalanced, I may return to it to add more modern features and a playable third party, but for now I’m ready to put this project behind me for the time being.
I’ve always had a bit of a bizarre fascination with U.S. elections. Not even necessarily over the politics themselves but the numbers and competition themselves. I get invested in them the same way some people get into baseball, poring over histories, charts, and statistics. Over the course of the pandemic, one of the things I found to pass my time was a web-game known as The Campaign Trail.
The premise of The Campaign Trail is pretty simple. You’re able to pick from various historical presidential elections (often ones which were rather close) and essentially replay them, taking the place of any of the candidates and watching as you make decisions for them. Through your decisions, it becomes possible to alter the outcomes of these elections. It was pretty fun, I even uploaded a Let’s Play back then.
However, the game’s developer has always been relatively inactive, so shortly after some time the game’s community got together, cloned the site, and began editing it to allow for modding support. With mods in the game now, it became possible to create our own scenarios.
Game modding in the abstract sense has generally interested me, as I find the whole idea of taking someone’s work and expanding on it in different ways to be rather cool. Since this was just HTML and JavaScript, a lesser-known game, and one which isn’t too large in scope I felt like I had a decent amount to contribute.
I tried monkeying around with the site a bit, managed to add a Credits section to allow mod creators to credit themselves and edited the site’s color palette to be more consistent.
Eventually I decided to try my hand at creating a mod, figured it would make a nice summer project. Little did I know how much of a slog it would be. The biggest issue I found, especially at the time where I started, is that this game (since it’s not designed to be modded) has next to zero documentation. Often times variables will exist where nobody in the community exactly knows how they work.
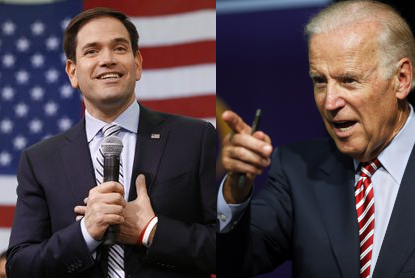
Either way, I got to making my own scenario. The scenario I decided to go with was the 2016 election, but with a bit of a twist: the nominees would be both Marco Rubio and Joe Biden, in turn providing a 2016 general election which would most likely look in line with the political environment of 2015. As I am rather young, I figured this would be a good pick as the key events and topics of discussion were very much within my memory.
The following sections are write-ups on various issues I ran into during the course of development and how I came to address them.
Background
The 2016 election was an incredibly pivotal one, not just in terms of the following administration, but in the ways it acted as a turning point for both parties and the ideological shifts they’d undergo. It’s very commonly argued that the catalysts for this were both the campaigns of Donald Trump and Bernie Sanders and the unexpected success they had running insurgent campaigns.
This mod provides a sort of “what-if” for neither of these populist campaigns really hitting their stride, the timeline where the 2016 election proceeded as expected by both parties’ establishments.
The pre-conditions for this scenario are as follows:
- Joe Biden has reason to run, defeating both Hillary Clinton and Bernie Sanders in the primary handily. Unlike in the main timeline, he exits the primary as a broadly popular figure among the base with some opposition from Sanders, but not to the same extent.
- Marco Rubio is somehow able to gather together a broad enough coalition to stunt Trump’s momentum in the primary and defeat him.
The specifics of this, such as whether or not the GOP primary goes to the convention or if Beau Biden still dies, I leave intentionally vague.
With all this set up, we get some pretty interesting dynamics going on with this matchup.
- Youth vs. Experience. Marco Rubio in a lot of ways modeled himself after Barack Obama, as a sort of fresh face.
- Sun Belt vs. Rust Belt. 2016 proved to be the beginning of a realignment of sorts as we began to see a rising Hispanic population turn many Sun Belt states from solid Republican to increasingly competitive. In the opposite direction, with widening polarization based on education, many Democratic strongholds in the Rust Belt began to shift right, improving Republican prospects. These shifts are part of a larger pattern, but solidified with the nomination of Trump in OTL. Rubio is a candidate with a good deal of Sun Belt appeal, whereas Biden’s image plays moreso to the Rust Belt.
- Optimism vs. Pessimism Throughout the Obama administration, the GOP relied on a good deal of negative campaigning and obstructionism in their messaging. Marco Rubio, however, ran his primary campaign on a clean-cut and optimistic platform. This is in contrast to Biden’s style, which is often more brash and rooted in experience.
Calculating Trump’s Bonus
Written: 7/26/2021
In the Rubio versus Biden mod, it is possible to end up triggering an event in which Trump enters the race should you choose the wrong answer at certain points. Seeing as an independent Trump here would completely go against simple partisan leans, I had to develop a few methods for calculation.
To begin, Trump’s baseline is set as around 12%. However, this isn’t a flat 12% across all states. The method of calculation varies depending on if I categorize a state as a blue, red, or battleground state. This post is going to be dealing with the method for the blue states, since those are the easiest.
For each state, I consult the 2012 election results for partisan distribution and then add/subtract Obama’s national margin (3.9%) so I get their pure relative lean. For example, CT was won by Obama with 58.06%. Subtract 3.9 from that to get 54.16%. From there, I multiply 54.16 by 15 percent? Why 15 percent? Because, according to the data at the time of the primaries, about 15 percent of Democrats had a favorable opinion of Trump, as per 538. Obviously, Dem support for Trump probably varies by state but data is nonexistent and given how solidly blue the following states are, I don’t think it matters.
The formula for the Dem-half is 13% baseline multiplied by the relative lean of a state multiplied by 15 percent (an exception is made for Delaware, Biden’s home-state, which grants Trump only a 10% multiplier among Democrats).
However, that only gives us Obama-Trump voters. What about Romney-Trump voters? This was probably the roughest part. I took the national polling average of 35 percent from around when the 2016 primary was at its most competitive as a baseline for what GOP support for Trump is nationally. However, GOP support of Trump also varies by state. So, what I did was I consulted the 538 polling averages from late-2015 to early 2016, and approximated a support level. For states where there isn’t enough primary data, I just maxed out the support level to 35% for the sake of simplicity and also to make Trump more impactful. To make sure I didn’t overall skew too high or too low, I calculated the average of these states’ numbers, and noted their deviation from the mean. We can then subtract the deviation from that base of 35 percent to get a more proper number of support per state.
The formula for the Republican-half is 13% baseline multiplied by the relative lean of a state multiplied by the ratio of the state-level GOP support over Trump’s national average of 35%.
You combine these two halves, and there’s the proper state-by-state baseline for what Trump’s support should hover around. I’ll have to vary up the methodology for red and battleground states since their dynamics are different I’d imagine, but I’ll get to that later.
Here’s another article I found in my research which I may take advantage of later.
Calculating Realistic VP Home-State Bonuses
Written: 8/20/2021
Perhaps out of boredom or maybe because I trust formulas more than my own hand-tweaking, I’ve been approaching the actual score/number generation with a series of formulas. This is what I did when determining Trump’s percentage for each state, and now it’s what I’m doing for the VPs.
Which back to our topic, here’s a fun fact about VP state bonuses in presidential elections: they’re inversely proportional to a state’s population. The smaller a state is, the more its population will care about having one of their own as VP. This might be bad news for VPs from California, but great news for me because this means I can create a formula in a straightforward fashion.
The first step is finding the scenario of maximum effect to use as a baseline. This gives me an idea of what is the peak potential of a VP-home state effect. Luckily in 2008, we were given data for just that. Sarah Palin is governor of Alaska, a small state.
McCain carried about 59.4% of the vote in 2008. Add his national loss margin of 7.2% to get 66.62%. Romney lost by 3.9% nationally in 2012 and held 54.8% of Alaska’s vote. Add 3.9% and I get 58.7%. Subtract 58.7% from 66.62% and you get 7.92% of a contribution from Sarah Palin specifically.
I did some testing and raising Rubio’s Alaska multiplier from 0.96 to 1.3 seems to get me close to 8 percent, which is what I need. That’s a difference of 0.34 in the multiplier.
I calculated Palin’s gain in multiplier terms as follows: 7.92% divided by 58.7%, then add 1. For the other home-states I took Alaska’s EV count (3) over their respective EV counts, multiplied by the Palin gain (in multiplier terms) we calculated at the beginning of this paragraph.
I took the other-state multiplier, divided it by the Palin multiplier, and then multiplied that ratio by whatever existing multiplier was in the game’s code for the candidate. This seems to have worked, with there being visible but not insane results due to your VP picks.
Some fun facts for those who sat through the math:
- Hillary Clinton has two home states, Arkansas and New York. This is done as an easter egg of sorts given that election data shows that she did gain support in certain areas of Arkansas which saw a reversion in the 2020 election.
- Hillary Clinton is the only VP with safe states as her home state, which is another reason I was fine giving her two, since it wouldn’t have that much of an effect either way.
- Hillary Clinton nets you about a 4 percent gain in Arkansas, making that the state with the largest sway.
- Ted Cruz currently holds the least sway, given that Texas’ population is larger than that of even New York.
Setting Up The Issues
Written: 8/8/2022
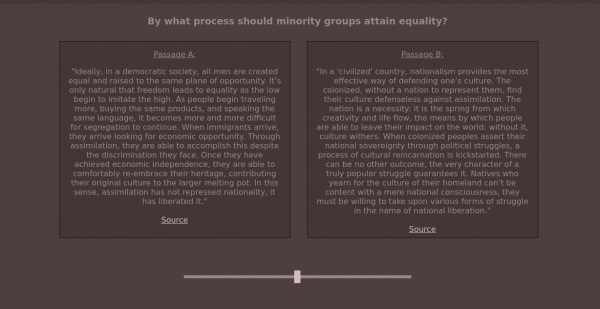
Unfortunately, there’s only room for five “Issues” in a CT game. Candidates, questions, and answers all have to fit within the stats for five policy issues you pick. I decided to go with five that were the most relevant to the political discourse surrounding the 2016 election specifically:
- Trade
- Immigration
- Foreign Policy
- Civility
- Socialism
These worked well for the most part, but I’d run into issues where a question doesn’t really fit the paradigm. Like when we give Rubio a question surrounding gay marriage, or Biden a question regarding climate change, which stat does that really correspond to? Both of these are issues that played a rather significant role in 2016, even if it wasn’t large enough to warrant its own category.
I’ve taken to assigning them as subcategories based on how issues are rhetorically connected or how voting blocs tend to group. Climate change denial is often paired with concerns about domestic workers, so we should expect it to roughly correspond with the Trade stat.
The sub-categories I’ve come up with are as follows:
- Trade:
- Climate Change
- Immigration:
- Crime
- Drugs
- Foreign Policy:
- Terrorism
- Privacy
- Civility:
- Donald Trump
- Social Issues
- Institutionalism
- Socialism:
- Healthcare
Blogger and software engineer. I write on tech, politics, and theology.